
Hello traders, welcome to all of you in the taplumarket Blog. In this article, we will learn how to start Trading. Nowadays many people want to earn money from the internet and there are many ways to earn money from the internet, out of which trading is also one way. Before learning about trading, let me tell you a little about my experience. I started my trading career in 2018 and you may not believe it, it took me 5 years to learn trading and the biggest reason for this was that there was no one to guide me. And I also bought many courses but I did not get to learn much from the course. But if you do trading well then you can earn money by trading.
I will tell you the right way to trade so that you can achieve success in the field of trading. And it is said that one should learn from the mistakes of others. So I will tell you step by step start trading.

How to Start Trading in Stock Market for Beginners 2025
What is Price Action in the Stock Market?
Price Action is one of the most important aspects of technical analysis for trading.
It can predict whether a stock’s price will rise or fall, whether momentum will increase or decrease, and so on.
If you do not know what price action is, you will likely not become a successful trader in the market.
The biggest use of price action is that you can know what is going to happen in the market just by looking at the price. From this, you must have understood what is Price action.
Both technical analysis and fundamental analysis are better for a trader and investor.
But a common investor and trader should pay more attention to technical analysis because big investors or institutions invest by looking at the fundamentals of the company and that information is visible to us on the chart.
FAQ
What is the difference between Fundamental Analysis and Technical Analysis?
In Fundamental Analysis, investors invest based on what the company is doing at the moment and what it will do in the future based on it.
In Technical Analysis, traders trade based on the price on the chart.
What is Fundamental Analysis?
Fundamental Analysis means that we get information about what the company is doing at the moment and what it will do in the future based on it.
What is technical analysis?
When we see the price on the chart, that price has its structure and language, technical analysis is the way to understand it.
Which method is better, Fundamental Analysis or Technical Analysis?
A common investor and trader should pay more attention to technical analysis because big investors or institutions invest by looking at the fundamentals of the company and that information is visible to us on the chart.
Support and Resistance
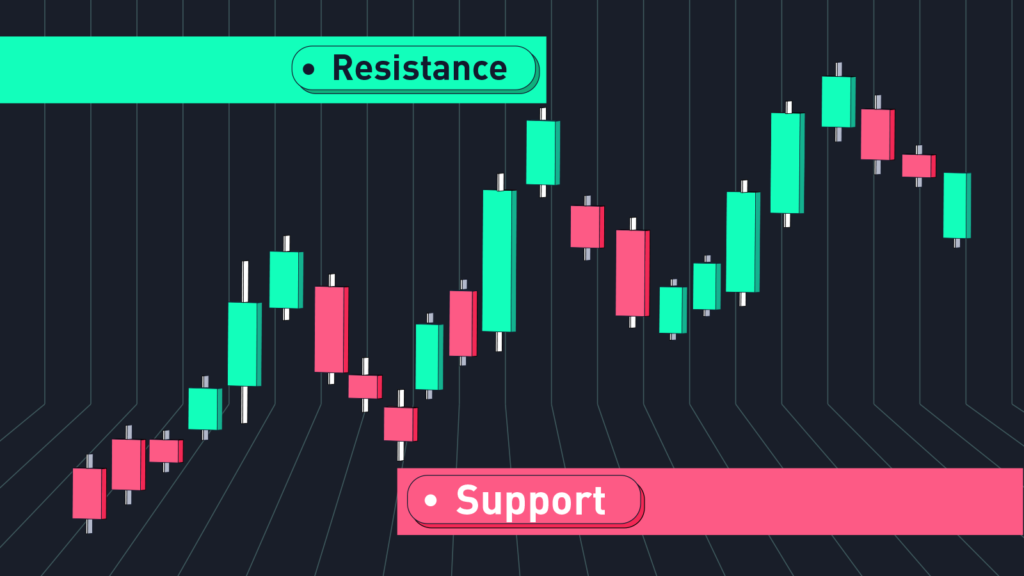
Support and Resistance are the levels on the chart where the price stops.
These levels tell us what the direction of the market will be. These are Price action support and resistance levels.
Support
Where the price comes from top to bottom. It prevents the price from going down. Here there is a possibility that if the price goes below the support then you have to sell.
Resistance
In this, the price comes from bottom to top. It prevents the price from going up. If the price breaks the support and goes up then there is a possibility of a boom in the market.
CANDLESTICK Stock Market for Beginners
By looking at the candlestick, you can find out what movements have happened or are going to happen in the stock at that time, we also call it candlestick price action. Different patterns are formed by combining candlesticks, which we call candlestick patterns.
Trend
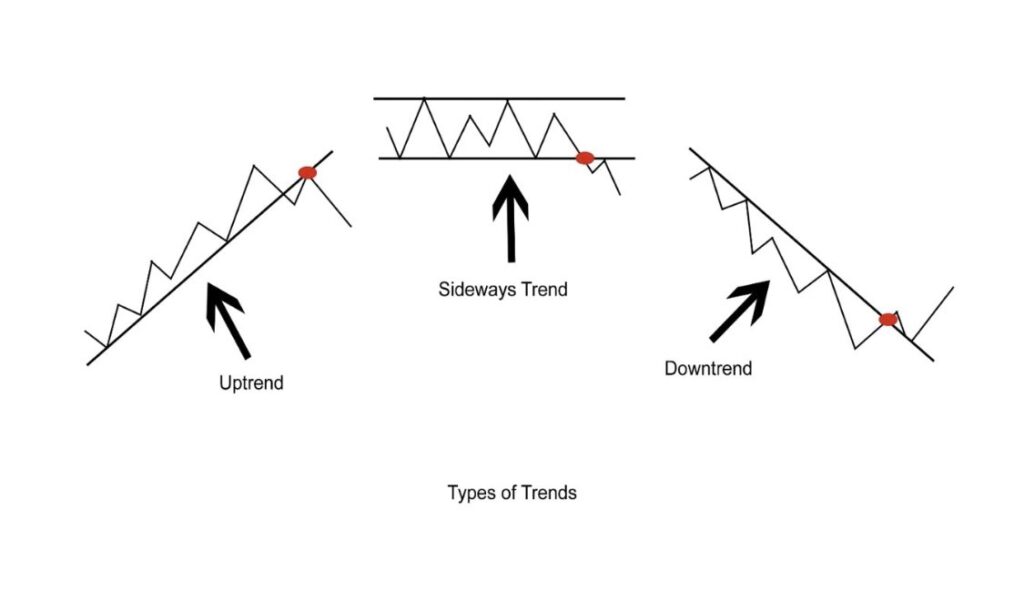
The market always moves in a trend. Those who trade with the trend have less loss in the stock market. Trend means the direction of the market. From this, we can know when we should buy, sell, or take a trade or not.
There are 3 main trends in the stock market.
- Down Trend
- Sideways Trend
- Up Trend
Chart Pattern
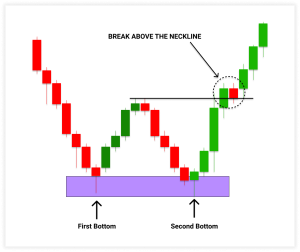
With the help of candlesticks or other technicals, some shapes are formed on the chart, which we call chart patterns. These chart patterns are formed over a long period of time.
TRENDLINE
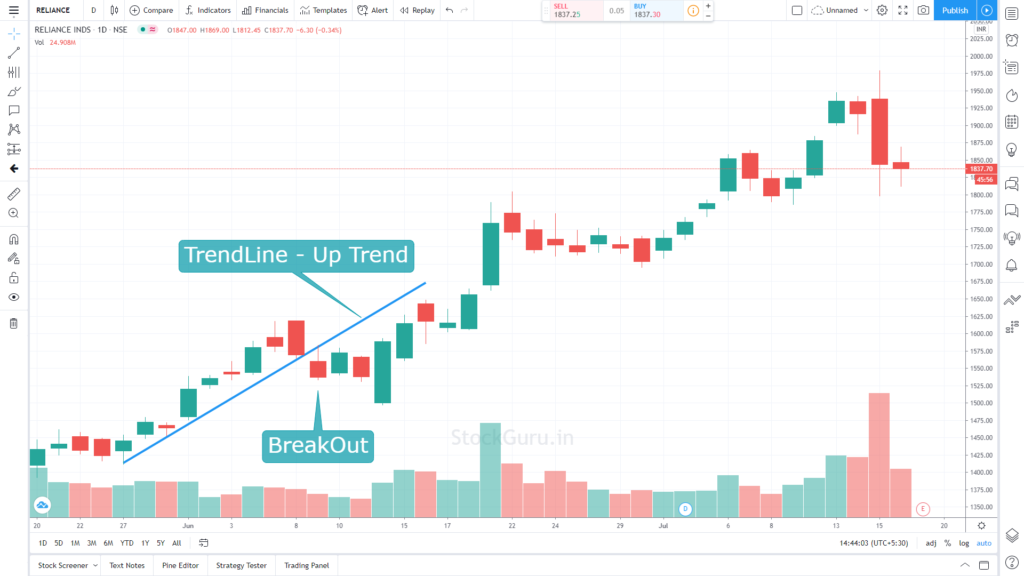
When the market moves up or down, it does not move in the same range.
With the help of a trend line, we can know the direction of this market.
With the help of this price action trendline, we can know the support and resistance of the trend.
The terms Price Action Breakout and Breakdown are often used interchangeably but they have very different meanings.
PRICE ACTION Breakout & Break down The terms are often used interchangeably but they have very different meanings.
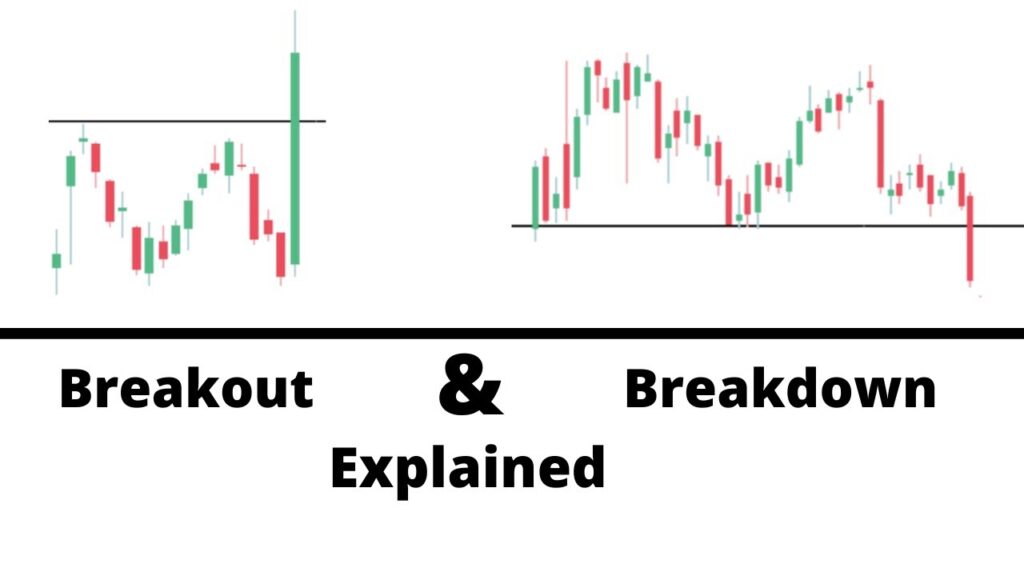
Breakout
When the price comes from below and goes above the Resistance Line, then we call it Breakout.
Breakdown
When the price comes from above and continues to go below the Support Line, then we call it Breakdown.
With the formation of these chart patterns, we can guess what the direction of the market is going to be.
Volume
The Volume shows how many shares buyers and sellers have traded that day. If there is more buying in the market, then the volume increases, which is shown in green. If there is more selling in the market, then the volume increases, which is shown in red.
FAQ
What is Price Action?

Price Action is one of the most important aspects of technical analysis for trading. It can predict whether the price of a stock will rise or fall, momentum will increase or decrease, etc.
Is price action trading the best?
The biggest use of price action is that you can know what is going to happen in the market just by looking at the price.
Because of this, you do not need to learn other technicalities. Learning price action is everything for a trader.
What is price action trading?
When we use only price action to trade, then it is called price action trading.
In this, trading is done without the help of any indicator or other technical. Only price action is used.
How much time does it take to learn price action?
If you practice all the lessons according to me, then you can learn
Price Action Trading in 3 months.
How many types of price action are there?
There are 2 types of price action in the stock market.
The first one is when a new trader starts, then he starts trading with the help of candlestick indicators etc. so that it becomes easier for him to trade. The second one who has become experienced in trading in the stock market, then he trades only by looking at the Price action Movement chart pattern.
Risk Reward
How to do Risk Reward Management?
A rule of 2% has been made in Risk Reward Ratio, this rule is famous all over the world.
If you have any amount then you cannot take a risk of more than 2% of that amount. There is a lot of volatility in the stock market, if the stock goes in the direction of your trade then you can earn a good profit.
If the stock market goes against your direction then all your money can also be lost.
What is Risk Reward Ratio?
When you trade using Technical Analysis, you are not always 100% right.
With Technical Analysis you can be right only 70% of the time and you will have a loss in 3 out of 10 trades.
When Technical Analysis goes wrong then we can reduce our loss with Risk Reward Ratio.
FAQ
What is Risk Reward Ratio?
Risk Reward Ratio means how much risk should we take in the stock market and how much reward or profit should we get based on that risk.
Why should we use Risk Reward Ratio?
If you want to earn good profit in this market and want to avoid loss, then you have to follow the Risk Reward Ratio.
What is the 1:3 rule in Risk Reward Ratio?
It means that if you are taking a trade, if your stop loss is Rs 1, then your target will be Rs 3.
When you trade using Technical Analysis, you are not always 100% right.
With Technical Analysis, you can be right only 70% of the time and out of 10 trades, you will have a loss in 3 trades.
When Technical Analysis goes wrong, then we can reduce our loss with Risk Reward Ratio.
Supply and Demand Levels in Stock Market
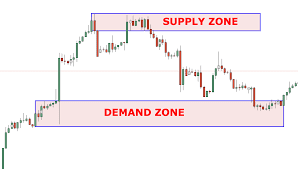
- Demand Level
When the price repeatedly takes support from a level and goes up. Then it is believed that at this level the demand is more than the supply. Here the possibility of a boom in the market is high.
- Supply Level
When the price repeatedly takes resistance from a level and goes down. Then it is believed that at this level the supply is more than the demand. Here the possibility of a boom in the market is high.
Supply and Demand in Share Market
What is Supply and Demand in Share Market?
What is Supply in Share Market?
Supply in means supply.
When the price on the chart touches a level and goes down with resistance repeatedly, we call it Supply.
What is Demand in Share Market?
Demand in means demand.
Basis of Supply and Demand in Technical Analysis.
- Uptrend
When the supply of a commodity is less and demand is more, then the price of the commodity increases, which we call uptrend.
2 .Downtrend
When the demand for a commodity is less and the supply is more, then the price of that commodity decreases, which we call Downtrend.
3. Sideways
When the supply and demand of a commodity are equal, then the price moves in a range, which we call a sideways trend.
Horizontal Support
- Minor Support
2. Strong Support
3. Very Strong Support
- The price while going down stops at a level and taking support there starts going back up. This first support is called minor support.
- After some time, the price again takes support near that place and again turns and goes up.
- This second support is called strong support.
- The third time the price again comes to that place and forms support, then it is called major support. This third support is very strong.
- It is not necessary here that only 3 supports can be formed together. More than 3 supports can also be formed.
- Here the price indicates that the demand is more than the price supply in the market, so the price is not going below the support, this is a sign of an uptrend.
Things to keep in mind in Horizontal Support and Resistance
When you see Horizontal Support and Resistance on the chart, it is very important to keep one thing in mind. When support and resistance are formed in the chart, there should be a gap of at least 7 to 8 candles between 2 supports and resistance. If there is no gap of 7 to 8 candles between 2 supports and resistance, then we cannot call it support and resistance.
There should be a gap of 7 to 8 candles between support and resistance.
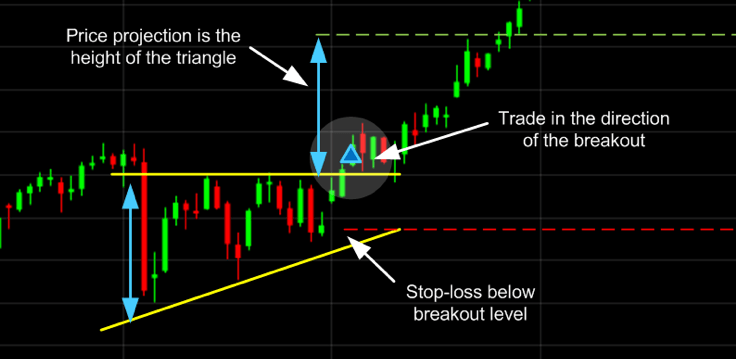
Trending Support

- First Support
- Second Support
- Third Support
Trending Support and Resistance
In the chart, we see that the market has started moving in an uptrend. In the uptrend, the first support is formed on the chart and after that, the market goes up. After this, the second support is formed in the chart but this support is higher than the first support.
Now that 2 supports have been formed, if you draw a trend line touching the low of the first and second support, then there is a high probability that the line will touch the third support when it is formed.
This means that the market will keep moving upwards.
TREDING RESISTANT
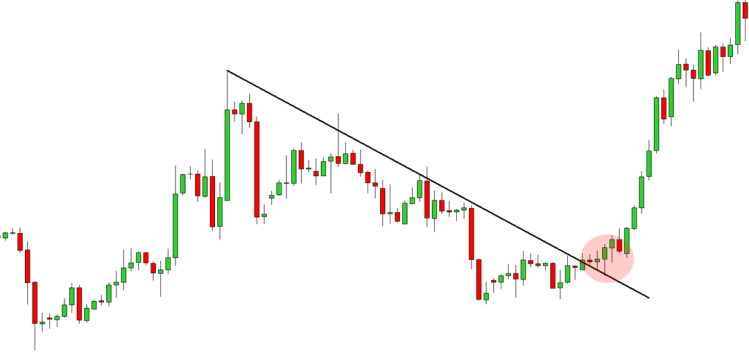
In the chart, we see that the market has started moving in a downtrend. While moving in the downtrend, the first resistance is formed on the chart and after that, the market goes downwards.
After this, the second resistance is formed in the chart but this resistance is downwards compared to the first resistance.
Now that 2 resistances have been created, if you draw a line touching the high of the first and second resistance, then when the third resistance is formed, there is a high possibility of that line touching that resistance.
This means that the market will keep going downwards.
Trading time Start Trading in Stock Market for Beginners
- SCALPING
It is done on candal from 1 to 3 minutes.
- Intraday
It is done on candal from 5 to 15 minutes.
- Swing Trading
It is done on candal from 1 hour to 1 day.
- Investing
It is done on candal from 1 week to 1 month.
Thanks to Note.
- Keep your setup good in trading (laptop, mobile computer, internet) so that you do not face any problems while doing any kind of trading.
- To move ahead in life, always keep your goal ready and work hard on it.
- Trading should always be done in a quiet place.
Conclusion
Friends, now I will tell you my experience at the end of this article, which will clear all your doubts about How to Start Trading in Stock Market for Beginners 2025,2026,2030 trading. You can make your life better by stepping into the stock market, but when you get useful information, then you will be able to understand the market well and earn good profit from here. Through this article, I have tried to give you the information that always works in the market, from which we make a profit. So, we pray to God that you move ahead in life.
Your well-wisher,
taplumarket
FAQ
Yes, you can invest 100 INR in shares, but your options might be limited depending on the stock price and the brokerage platform you use. Some brokerages offer fractional shares, which means you can buy a portion of a share if you don’t have enough money to buy a whole one. Additionally, some stocks are priced lower, and you might be able to buy a few units of those.
Ques-2 How to earn 500 RS per day in share market?
Earning 500 RS per day in the stock market can be achievable, but it requires a combination of strategy, skill, and a clear understanding of the risks involved.Here are a few approaches you could consider:
1. Intraday Trading
2. Swing Trading
3. Investing in Dividend Stocks
4. Options Trading
5. Using Leverage (Margin Trading)
6. Focus on Small-Cap or Penny Stocks
Ques-3 How do I start trading in the Indian stock market?
Starting trading in the Indian stock market involves a few important steps. Here’s a guide on how to get started:
1. Understand the Basics of Stock Market
2. Choose a Reliable Stockbroker
3. Get Familiar with the Trading Platform
4. Learn About Different Types of Orders
5. Start Small and Make Your First Trade
6. Develop a Strategy
7. Monitor and Stay Updated
8. Risk Management
- Apple (AAPL)
- Microsoft (MSFT)
- Johnson & Johnson (JNJ)
- Coca-Cola (KO)
- Hdfc Bank
- Kotakmehandra Bank
- ICICI Bank
- Reliance
- ITC Ltd.
- SBIN Bank
- PNB


Nice stock market learning