
WHAT IS A CANDLESTICK CHART PATTERN?

A candlestick pattern is a visual representation of price movements over time, used by traders and analysts to predict future price changes.

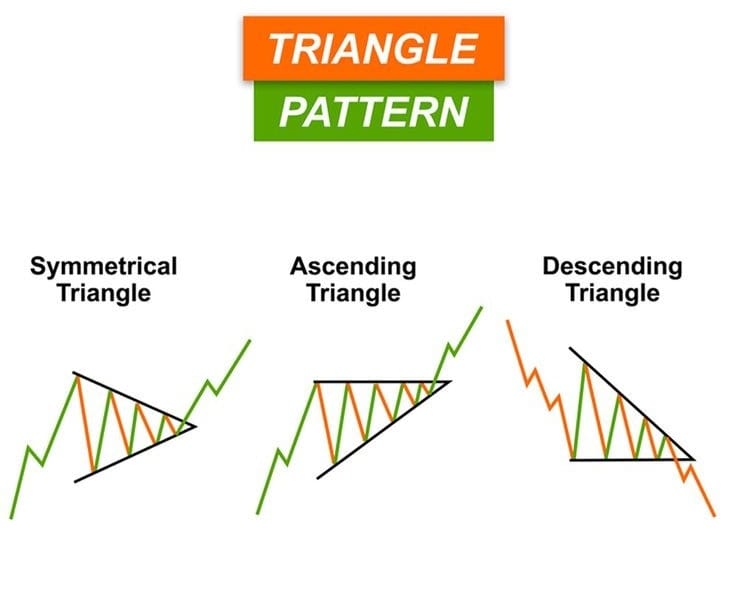
There are three types of candlestick chart patterns.
-
Symmetrical Triangle Pattern
-
Ascending Triangle Pattern
-
Descending Triangle Pattern
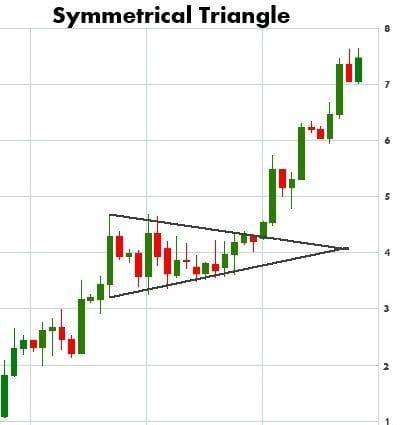
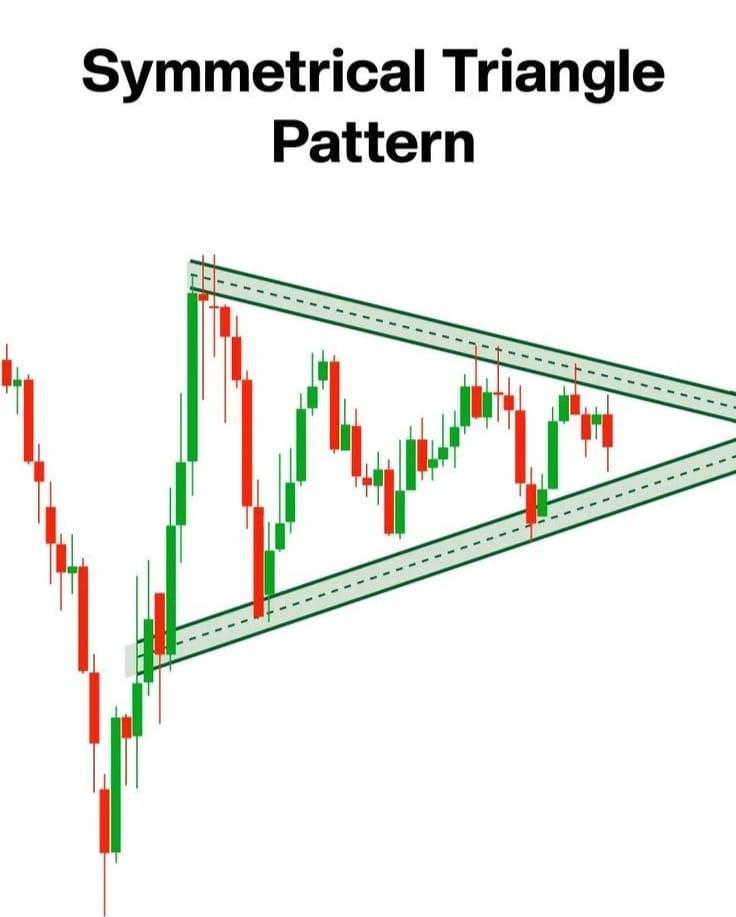
Symmetrical Triangle Pattern
Pattern Formation
1. Descending Upper Trendline
2. Acceding Lower Trendline
3. Narrow the Range of the candles in Between
4. Final Breakout on the Upper Side
The symmetric triangle pattern is bullish.
How to see the symmetric triangle pattern on the chart.
This is the first trendline which will come from above and the second trendline will be made narrow from that niche and the breakout will be towards the above. From here the market will move to the upper side.
How to Trade Entry?
1. Take Entry only After an Upper Breakout
2. Stop Loss Below Previous Swings Bottom
3. Target should be Equal to First Downswing Move ( High to Low )
How to put stop loss in a symmetric triangle pattern. When the Breakout comes, we will create an entry for it and we will decide its target from there and where our stop loss will remain, we will see where the swing has come and on that, we will place the stop loss. This is how we can see the symmetric triangle pattern in the market.
Ascending Triangle Pattern
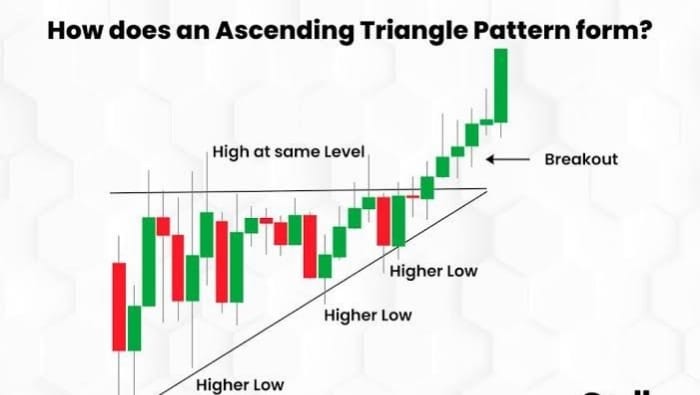
The ascending triangle pattern is bullish. And the trend line that comes from below should go upwards.
In which the market price will continue to narrow.
Pattern Formation
1. Flat Upper Trend Line
2. Ascending Lower Trend Line
3. Narrow the range of the candles in between
4. Final breakouts on the upper side
How to see the Ascending Triangle Pattern on a chart
Here we will see that the first trendline that appears should be flat. This is where market breakouts will come and from here the market will move upwards.
How to trade entry?
1. Take entry only after the upper breakout
2. Stop loss below the bottom of the Previous swing
3. Target should be equal to the first downswing move (High to Low)
When the Breakout comes, we will create an entry for it and we will decide its target from there and where our stop loss will remain, we will see where the swing has come and on that, we will place the stop loss. This is how we can see the Ascending triangle pattern in the market.
Descending Triangle Pattern
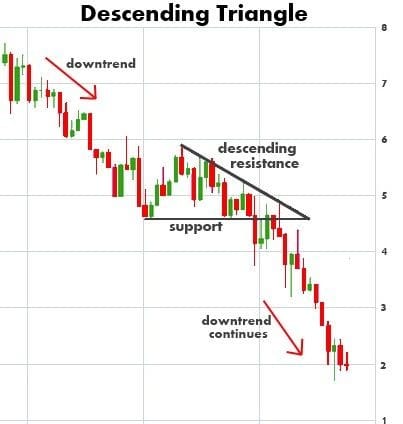
Pattern Formation
1. Descending upper trend line
2. Flat lower trend line
3. Narrow the range of the candles in between
4. Final Breakout on the lower side
The first trend line we will see on the chart will come from top to bottom. The trend line below will remain flat, The price that remains in the market will move within both the trend lines, creating a trough. Here there will be a downward breakdown and then the market will move downwards.
How to trade entry?
1. Take entry only after a low breakdown
2. Stop loss above previous swings
3. The top target should be equal to the first of the Swing moves (low to high)
Our entry will be where there is a breakdown in the chart. Our stop loss will be our stop loss. We will see in the chart where the swing has come and that is where our stop loss will be. This is how the descending triangle pattern works in the market.
Falling Wedge Pattern
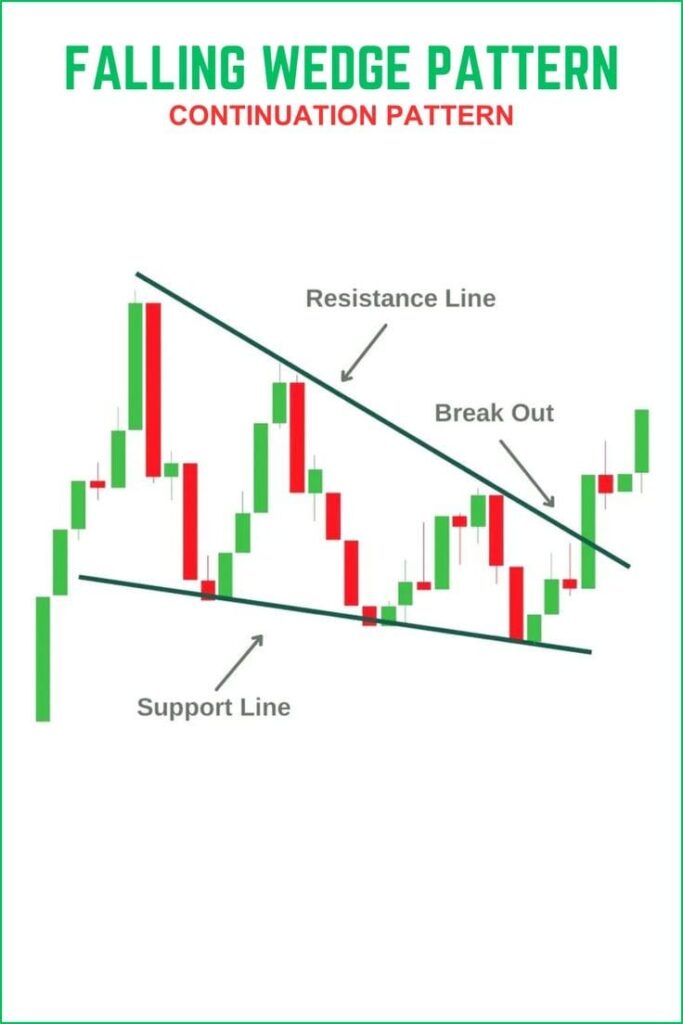
The Falling wedge pattern is bullish.
Pattern Formation
1. Descending upper Trendline
2. Descending Lower Trendline
3. Narrow the Range of the candles in between
4. Final Breakout on the higher side
First, there will be one buying, then the market will go into the range, a breakout will come and from here the market will go to the upper side.
How to Trade Entry?
1. Take entry only after the upper breakout
2. Stop loss below the Previous bottom of the Swing
3. Target should be equal to the first Downswing move (High to Low)
Here the breakout will come, this is where the market will move to the upper side. This is where we will enter. This is where we will keep our target, this is where we will see where the swing will come, where our stop loss will remain. This is how the Falling Wedge Pattern works in the market.
Rising Wedge Pattern
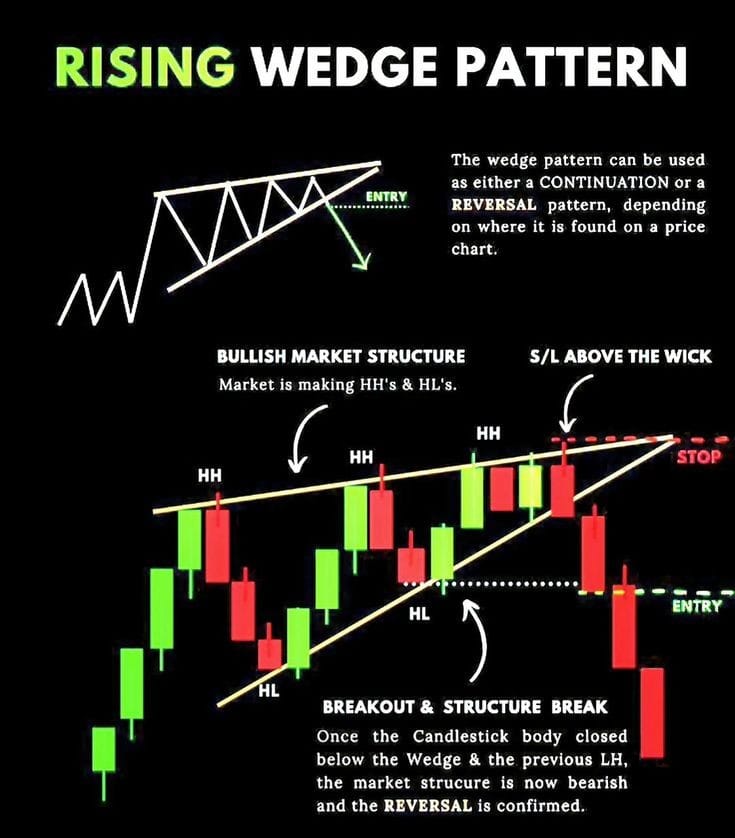
The Rising wedge pattern is Bearish.
Pattern Formation
1. Ascending upper Trendline
2. Ascending Lower Trendline
3. Narrow the Range of the candles in between
4. Final Breakout on the lower side
In a rising Wedge Pattern, we will see that first from upper to downside there will be selling, then there will be some buying on it or there will be breakdown on it, its formation comes in different ways.
How to trade entry?
1. Take entry only after a lower breakdown
2. Stop loss above previous swings Top
3. Target should be equal to the first upswing move( Low to High)
Trendline will be placed on the chart from the upper or downside, where the breakdown will appear and the entry will be taken.
You will see below where the swing has come and where we have placed our stoploss. Our target will remain from the first trendline to the second trendline. This way we can follow the rising wedge pattern.
Rectangle Pattern Bullish
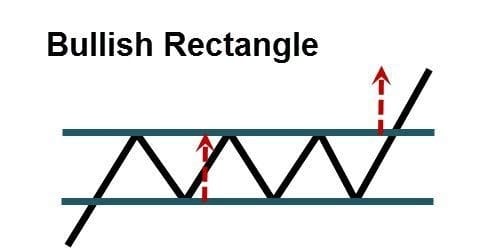
Rectangle bullish pattern formation
1. Flat upper Trendline
2. Flat lower Trendline
3. Consolidation in between for some time
4. Final Breakout on the Upper Side
This pattern is very common in the market and a lot of money can be earned in it. We will see on the chart that first there will be a buying trend and then the market will move into the range, after the range the final Breakout will come, and from here the market will move into the Upper Side.
How to trade entry?
1. Take entry only after the upper breakout
2. Stop Loss Below Previous support
3. Target should be equal to the first upswing move (Low to High)
On the chart we will see where the final Breakout will come from, from here the market will move to the Upper Side. Our entry will be placed there, which will be our target will be decided from here. In this way, it will be called a bullish rectangle pattern.
Rectangle Pattern bearish
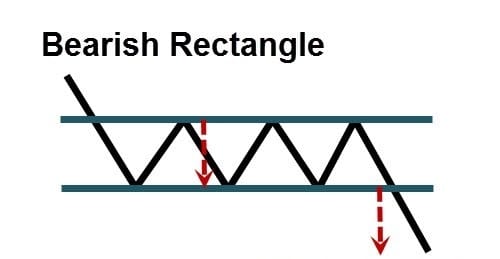
Rectangle Bearish Pattern Formation
1. Flat Lower Trendline
2. Flat Upper Trendline
3. Consolidation in between for some time
4. Final Breakout on the Lower Side
This pattern is very common in the market and a lot of money can be earned in it. We will see on the chart that first there will be a selling trend and then the market will move into the range, after the range the final Breakdown will come, and from here the market will move into the Lower Side.
How to trade entry?
1. Take entry only after the Lower breakdown
2. Stop Loss Above Previous support
3. Target should be equal to the first Downswing move (High to Low)
On the chart we will see where the final Breakdown will come from, from here the market will move to the Lower Side. Our entry will be placed there, which will be our target will be decided from here. In this way, it will be called a Bearish rectangle pattern.
Flag Pattern Bullish
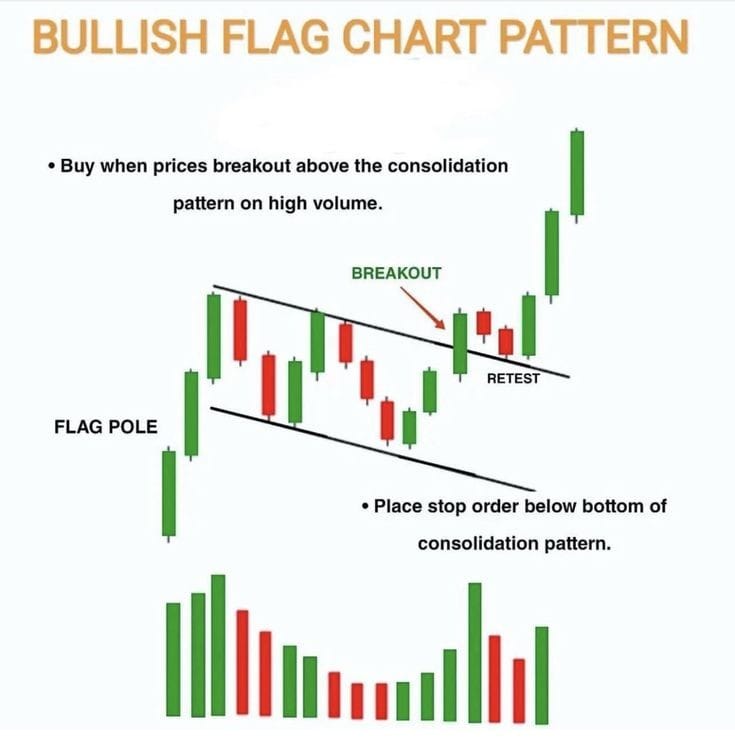
Pattern Formation
1. Quick and Big Up move in one or Two Candles
2. Small Sideways to Negative Consolidation
3. Remain in Range for sometime
4. Final Breakout on the Higher side
In this first, there will be a big move towards the upper side, and then the market will move into the range. A breakout will come here and then the market will move towards the upper side from here.
How to Trade Entry?
1. Take entry Near the Bottom of the Flag or After the Breakout
2. Stoploss Below the Bottom of the Flag or Middle of the First Pole
3. target should be Equal to First Up Move (POLE LENGTH)
Where there will be a breakout in the market, we will enter here and our stop loss will be on the downside. This way we can read the Flag Pattern better.
Flag Pattern Bearish
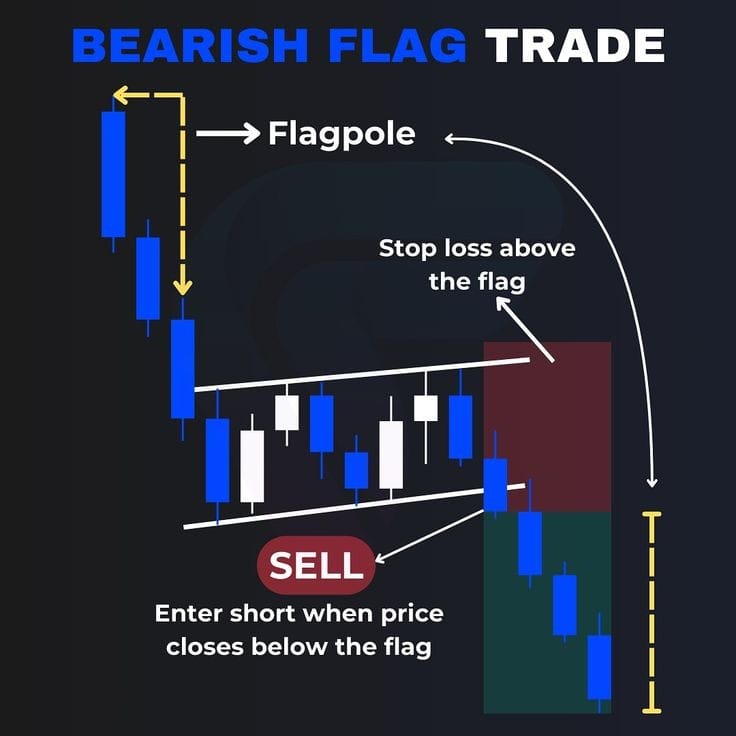
Pattern Formation
1. Quick and Big Down move in one or Two Candles
2. Small Sideways to Positive Consolidation
3. Remain in Range for sometime
4. Final Breakdown on the Lower side
In this first, there will be a big move towards the downside, and then the market will move into the range. A breakdown will come here and then the market will move towards the downside from here.
How to Trade Entry?
1. Take entry Near the Top of the Flag or After the Breakdown
2. Stop loss Below the Top of the Flag or Middle of the First Pole
3. Target should be Equal to First Down Move (POLE LENGTH)
Where there will be a breakdown in the market, we will enter here and our stop loss will be on the upperside. This way we can read the Flag Pattern better.
Cup and Handle Pattern
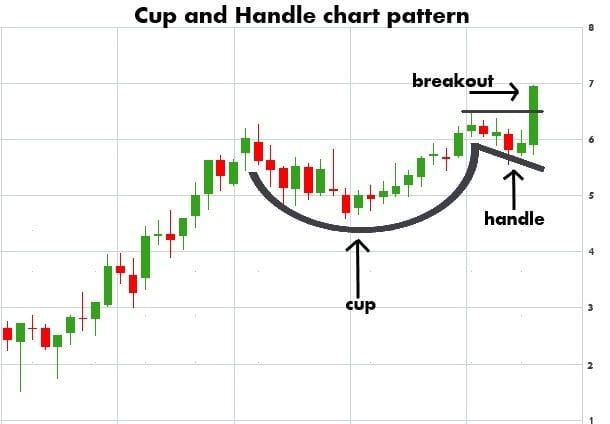
The Cup and Handle Pattern is Bullish
Pattern Formation
1. Long and steady uptrend in starting
2. Profit Booking and Rounding Bottom formation
3. Complete recovery and small profit Booking again
4. Final Breakout above the Previous Two reversal Points
In this pattern, buyers come first. After this market cup is made, then a handle will be made here, after this breakout will come from here due to which the market will move to the upper side.
How to Trade Entry?
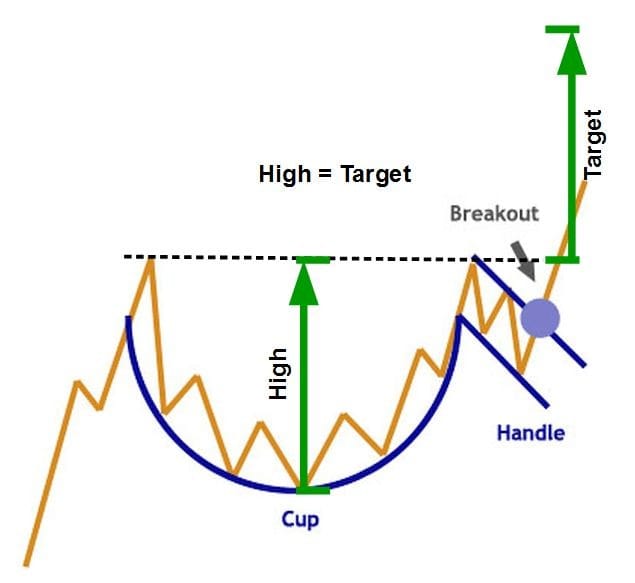
1. Take entry near the bottom of the Handle or break out after Double Top
2. Stop loss below Cup Pattern or Below Handle Low
3. The target should be Equal to the previous uptrend Cup Size ( Cup length)
As soon as there is a breakout in the market, only they can take entry. The target will be the cup size. In this way, the cup and handle pattern can be seen in the market.
Double Top Pattern
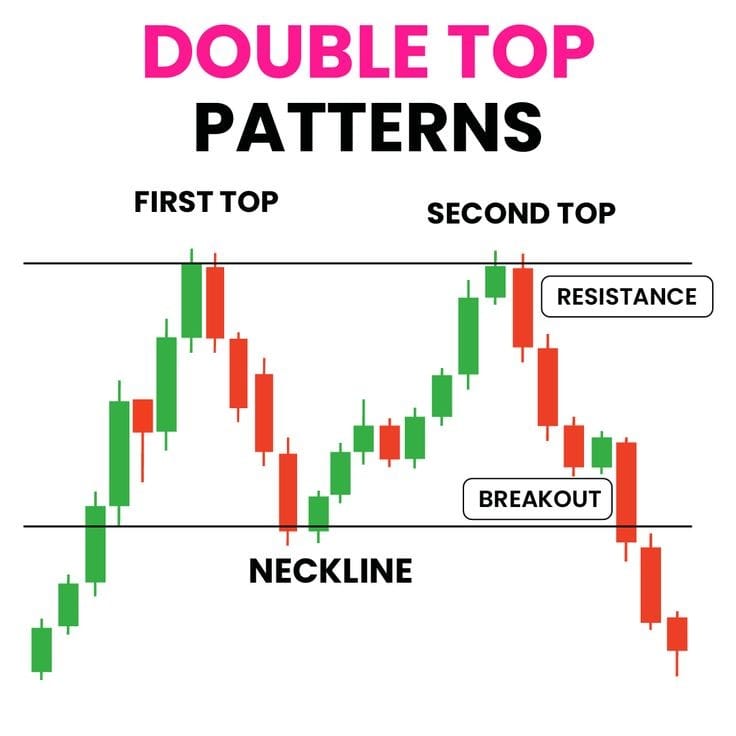
The Double Top Pattern is Bearish
Pattern Formation
1. Big Up move in the start
2. 20% to 50% Profit Booking From Top (Top1)
3. Another Up move reversal near Previous Top 2 (Top 2)
4. Final Breakdown Below Neckline and reversal from Previous resistance (Top1)
If you look at the chart first, buying will come, then profit booking will come, after this, the market will go a little downside, then profit booking will come, then from here the market will go upwards, then profit booking will come from here, then the market will move downside from here. There will be a breakdown in the market near the neckline, due to which the market will move downside.
How to Trade Entry?
1. Take entry near the second Top or after Neckline Breakdown
2. Stoploss above first Top or last Swing above Neckline
3. Target should be Neckline Length of the first Top to Neckline
Our first entry will be in the top 2, our target will remain till the neckline, the second entry will be after breaking down at the neckline, our target will be from the Top 1 to the downside of the neckline, in this way, we can achieve our target with the double top pattern.
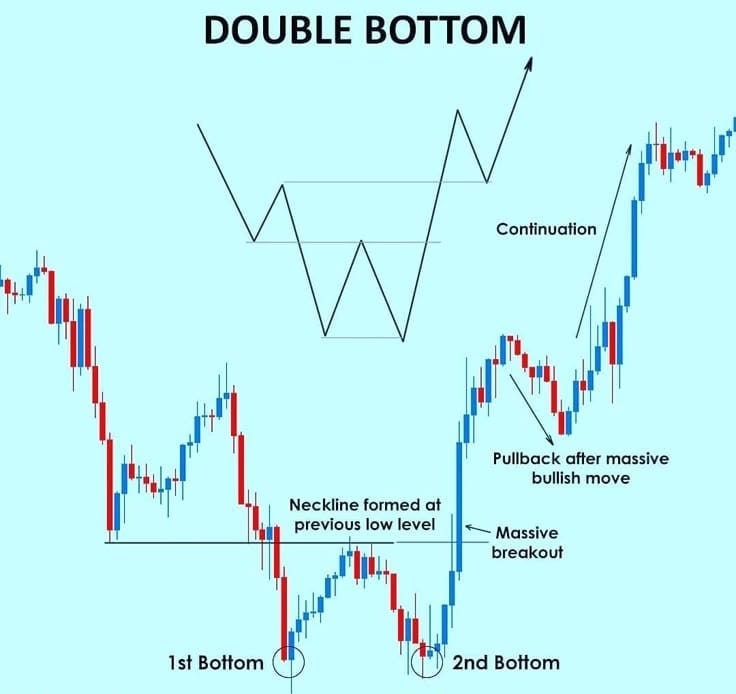
Double Bottom Pattern
The Double Bottom Pattern is Bullish
Pattern Formation
1. Big Down move at the start
2. 20% to 50% Profit Booking From Bottom (Bottom 1)
3. Another Down move reversal near Previous Bottom 2 (Bottom 2)
4. Final Breakout Below Neckline and reversal from Previous resistance (Bottom 1)
If you look at the chart first, selling will come, then profit booking will come, after this, the market will go a little Upside, then profit booking will come, then from here the market will go downwards, then profit booking will come from here, then the market will move Upside from here. There will be a Breakout in the market near the neckline, due to which the market will move Upside.
How to Trade Entry?
1. Take an entry near the second Bottom or after the Neckline Breakout
2. Stoploss above the first Bottom or last Swing below Neckline
3. The target should be the Neckline Length of the first Bottom to Neckline
Our first entry will be on the Bottom 2, our target will remain till the neckline, the second entry will be after the breakout at the neckline, our target will be from the Bottom 1 to the Upside of the neckline, in this way, we can achieve our target with the double Bottom pattern.
Head and Shoulder Pattern
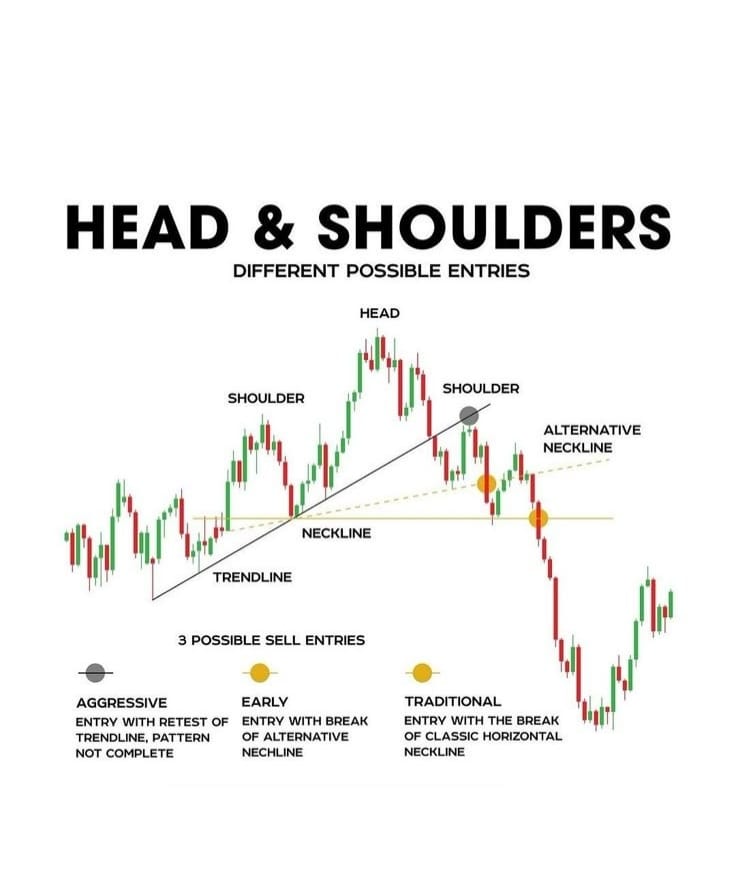
The Head and Shoulder Pattern is Bearish
Pattern Formation
1. Small up move in the beginning and complete reversal
2. Took support and made a bigger Move but again a complete reversal
3. Took support from Previous Bottom and again small up move
4. Final Breakdown Below Previous Two support (Neckline)
We will see on the chart that the first buying will come due to which the market will form a left shoulder, then the market will go to the upper side and form a head, in this way we will see the right shoulder in the market, after the market comes to the neckline there will be a breakdown here. Then the market will move downside.
How to trade entry?
1. Take entry after candle break or sustain Below Neckline
2. Stop loss above right Head
3. Target should be equal to Head High to Neckline
In this pattern, the target will be decided on the neckline, there will be a breakdown here and only after that you can take entry. The target will be from the upper part of the head to the neckline, in this way, you can take your target from the Head and Shoulder Pattern.
Inverted Head and Shoulder Pattern
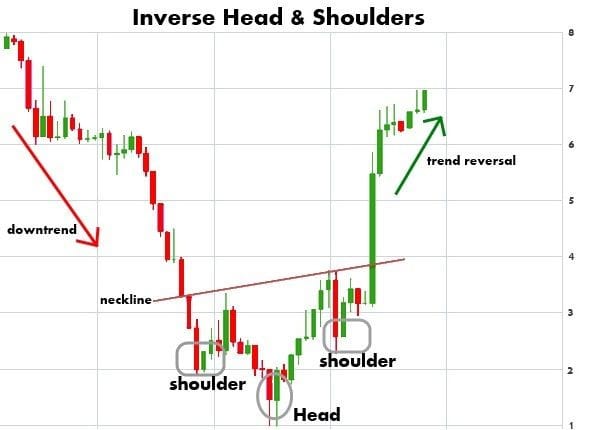
The inverted Head and Shoulder Pattern is Bullish
Pattern Formation
1. Small move in the beginning and a complete reversal
2. Took resistance and made a bigger Move but again a complete reversal
3. Took support from Previous High and again small Down move
4. Final Breakout Above Previous Two support (Neckline)
We will see on the chart that the first selling will come due to which the market will form a left shoulder, then the market will go to the Lower side and form a head, in this way we will see the right shoulder in the market, after the market comes to the neckline there will be a breakout here. Then the market will move Upside.
How to trade entry?
1. Take entry after candle break or sustain Above Neckline
2. Stop loss Below right Head
3. Target should be equal to Head Low to Neckline
In this pattern, the target will be decided on the neckline, there will be a breakout here and only after that you can take entry. The target will be from the Lower part of the head to the neckline, in this way, you can take your target from the inverted Head and Shoulder Pattern.
PROS & CONS
Entry 40% Breakout Fails
Target 40% Breakdown Fails
Stoploss 40% Stoploss Hits
FAQs
Ques.1 Which Candlestick Pattern is Most Reliable?
The best candlestick patterns are often determined by whether the market is bullish or bearish. These patterns show a strong change in market sentiment and often occur only after significant price movements.
Ques.2 Does Candlestick Pattern Analysis Really Work?
Candlestick pattern analysis can be effective when used in combination with other technical tools and indicators. Only then does the candlestick work.
Understanding candlestick patterns can provide valuable insight into market psychology and potential price movements.
Ques 3. Do Professional Traders Use Candlestick Patterns?
Yes, professional traders often use candlestick patterns as part of their technical analysis toolkit.
These can be used to identify trading opportunities.
Ques.4 What is the Success Rate of Candlestick Patterns?
The success rate of candlestick patterns varies depending on the specific pattern, market conditions and time frame. On average, popular patterns like Bullish Engulfing or the Hammer can have a success rate between 65% to 75% when combined with other indicators or technical analysis tools.
Ques. 5 Which is the best Candlestick Pattern?
Pattern consisting of long bullish candlesticks, each closing higher than the previous one, indicating strong buying momentum.
- Morning Star Pattern
2. Evening Star Pattern
3. Bullish Engulfing
4. Falling Wedge Pattern
Ques. 6 What is the best book on trading?
Search for the top 10 business books of all time, then select a title to learn more about the book.
Market magicians. ,
When genius fails. ,
Investment Biker. ,
One Up on Wall Street. ,
Pit Bulls: Lessons from Wall Street’s Champion Day Trader. ,
Memories of a Stock Operator. ,
Intelligent investor.
Ques.7 Which trading is most successful?
1 Top 5 Trading Strategies
Momentum Trading.
2 Intraday trading
3 Gap And Go Strategy. …
4 Bull and beer Flag Trading Strategy. …
5 Breakout Strategy. …
6 Scalping.
Ques.8 Which trading is best for beginners?
Because of this low speed, futures trading is best suited for beginners. The probability of success is also highest here – but the risk should still be taken seriously! Although they are particularly suitable for beginners to trading.
Ques. 9 Can I invest 100 rs in stocks?
Yes, you can start investing in shares with just Rs. 100. Many online brokerage platforms in India allow you to invest in small amounts. However, keep in mind that with such a small investment, your returns will be limited and the risk involved will be high.
Ques.10 What is the best rule for trading?
Rule 1: Always Use a Trading Plan.
Rule 2: Trading Like a Business.
Rule 3: Use Technology analysis.
Rule 4: Protect Your Trading Capital.
Rule 5: Risk Management Only You Can Afford to Lose.
Rule 6: Develop a Methodology Based on Facts.
Rule 7: Always Use a Stop Loss.
Conclusion: Congratulations on reaching the end of this comprehensive guide! You’ve taken an important step towards gaining an edge in the markets. Remember, trading with candlestick patterns through diligent practice, integrating robust risk management, and learning from each trade. Success in trading is a journey of continuous skill enhancement, balancing pattern recognition with effective capital preservation strategies and embracing every experience as a valuable lesson. But knowledge alone isn’t enough; you need the right platform to apply it. So that you can apply our written post properly on the chart. This will give you a lot of information about the market.


