
The Japanese have used candlestick charts to analyze rice prices since the 17th century. Candlestick patterns were introduced into modern technical analysis by Steve Nisson in his book Japanese Candlestick Charting Techniques.
Candlesticks contain the same data as a normal bar chart but highlight the relationship between the opening and closing prices. The narrow stick represents the range (high to low) of prices traded during the period while the wide middle section shows the opening and closing prices. For beginners, read the post below to learn about How to read candlestick charts for beginners 2025.
Candlestick Charts Pattern Basic
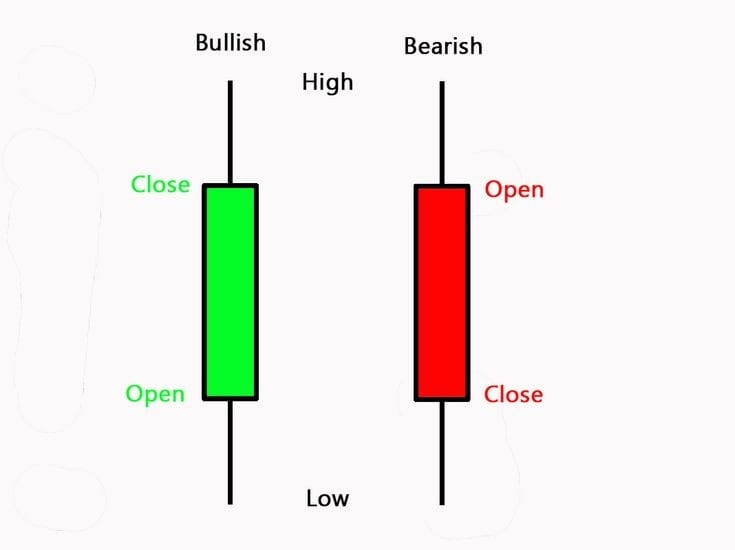
If we see the candle green in the market then its opening starts from where it is the opening point, or where we close the candle by making it close to the close point, we can make the shadow high and make the upper shadow low or make the niche shadow low.
> Like this, a red candle is the opposite of a green candle.
>These two candles are the main ones in running the market.
>A green candle will be called bullish.
>The red candle will be called bearish.
Piercing Line Pattern
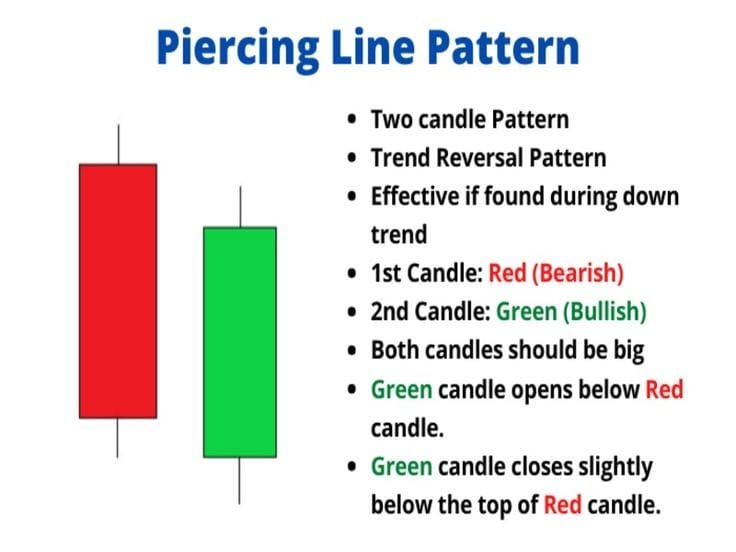
There was 1 red candle in the piercing line pattern. This candle will be the rain candle. The next candle that comes up should be green. Keep in mind that the green candle that comes after the red candle should close on the upside in the half of the closing red candle so that this piercing line pattern remains. This pattern will be formed in the chart and then it will trend in the market on the chart.
Dark cloud cover

First 1 green candle will appear under a dark cloud cover, this candle will be called a bullish candle. The next candle that comes should be red. It is important to keep in mind that the green candle will be closed after the green candle and the red candle will come, its closing should be closed on the downside in the half of the green candle so this dark cloud cover pattern will remain. This pattern will be formed in the chart and then this chart will trend down. Read the post below to learn about candlestick charts.
Dragonfly Dogi
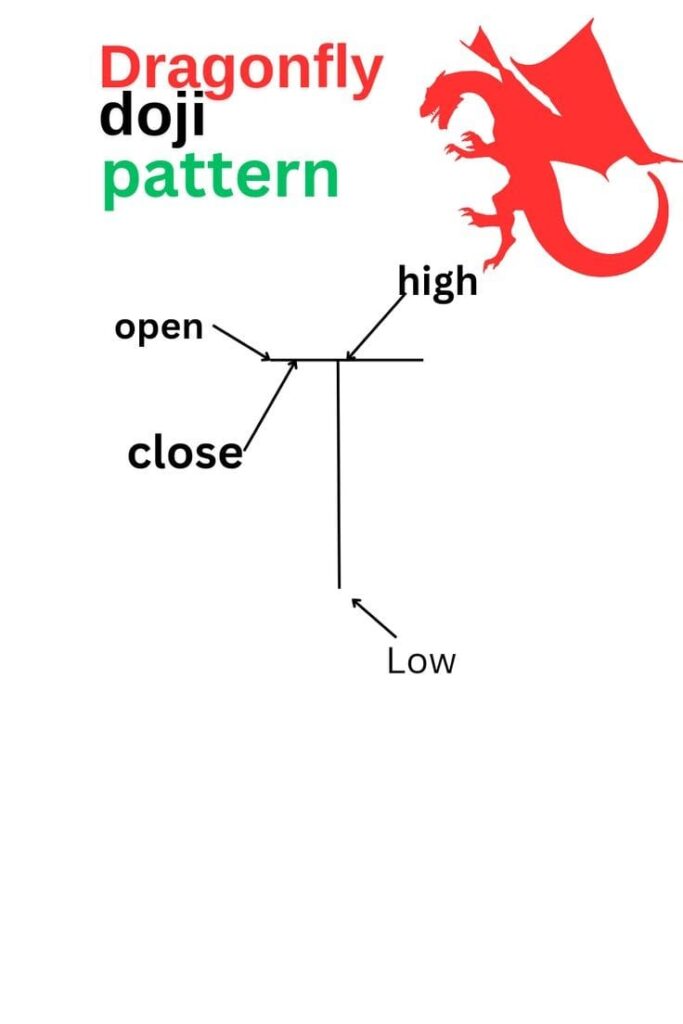
This is a bullish candle. You will see that the candle closes wherever it opens. You will see one long shadow in this. We will see this on the chart at the bottom. After the formation of this candle, the market trend changes and will trend on the upside.
Gravestone Dogi
These candles are the opposite of Dragonfly Dougie. We will see it on the upper side of the chart. After the formation of this candle, the trend of the market changes and it will trend downwards.
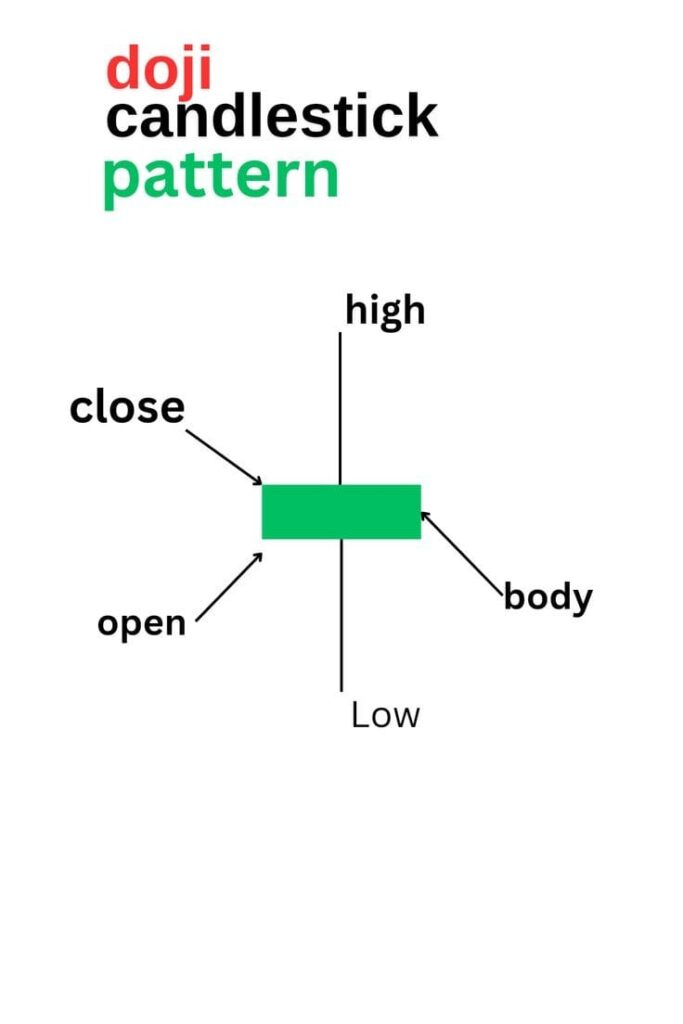
DOJI & LONG-LEGGED DOGI
Both these candles are bullish and bearish. Doji Candle has an open and closed evening. Here high and low remain only in the evening. And high and low remain long, this is the difference between these two candles.
How to see them on the chart
First, there will be buying in the chart then there will be the formation of candles where Doji or Long Legged Doggie will be seen and from there the market will change its trend to the downside.
ENGULFING LINE BULL
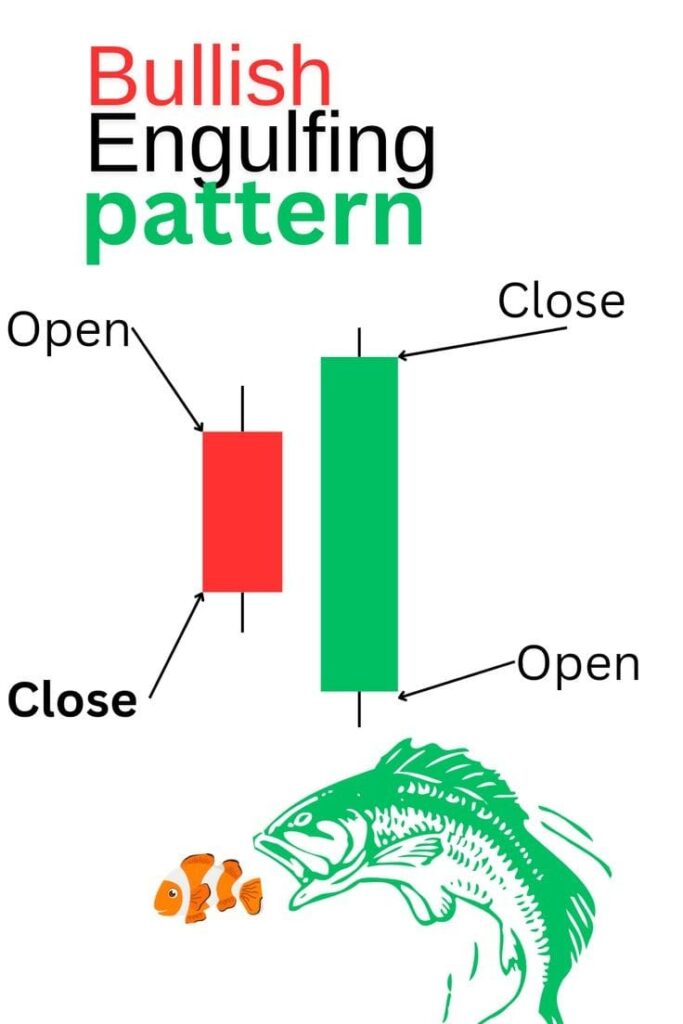
This candle is bullish. In this, the first bearish candle will come, and after this, the second candle will come, they will completely close the first candle, this candle will be called bullish engulfing.
There will be a downtrend on this candle chart, then this candle will be formed, and then from here, the market will change its trend to the upside.
ENGULFING LINE BEAR
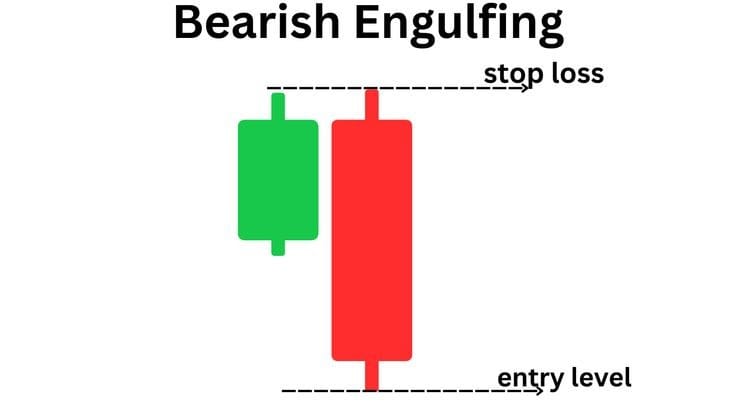
This is candle bearish. In this, the first bullish candle will come and after this the second candle will come and they will completely eclipse the first candle. This candle will be called bearish engulfing.
An upward trend will appear on this candle chart, then this candle will be formed and from here the market will change its trend to the downside.
HAMMER & HANGING MAN
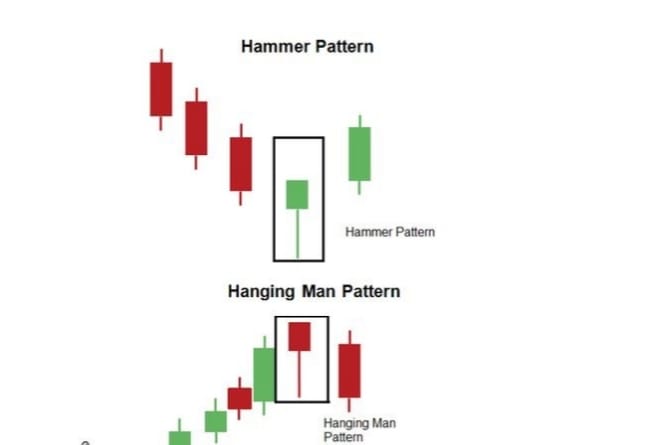
Here the candle formation will take place in the evening. Its body will remain small and its shadow will remain long. These are both bullish and bearish candles:
Hammer Candle on the chart: Only after we get a downtrend, the market will change its trend to the upside from where there is a demand for a hammer candle.
After the 1st trend appears on the hanging man candle chart, there will be a firmament, and from there, the market will change its trend to the downside.
INVERTED HAMMER & SHOOTING STAR
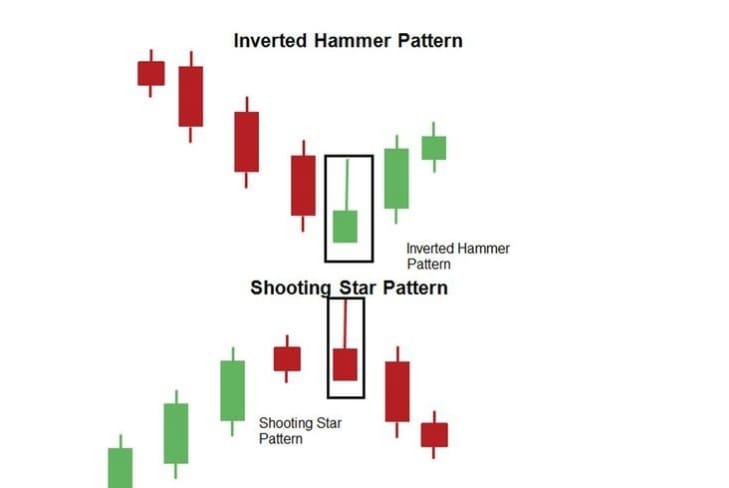
This is the opposite of Hammer & Hanging mind. Its body will remain small and its shadow will remain long. These are bullish candles and bearish candles.
On the chart, after a downtrend, we will see an inverted hammer candle formation on which the market will change its trend to the upside.
After the 1st trend appears on the shooting star candle chart, a formation will take place and from there the market will change its trend to the downside. How to read candlestick charts for beginners.
EVENING STAR
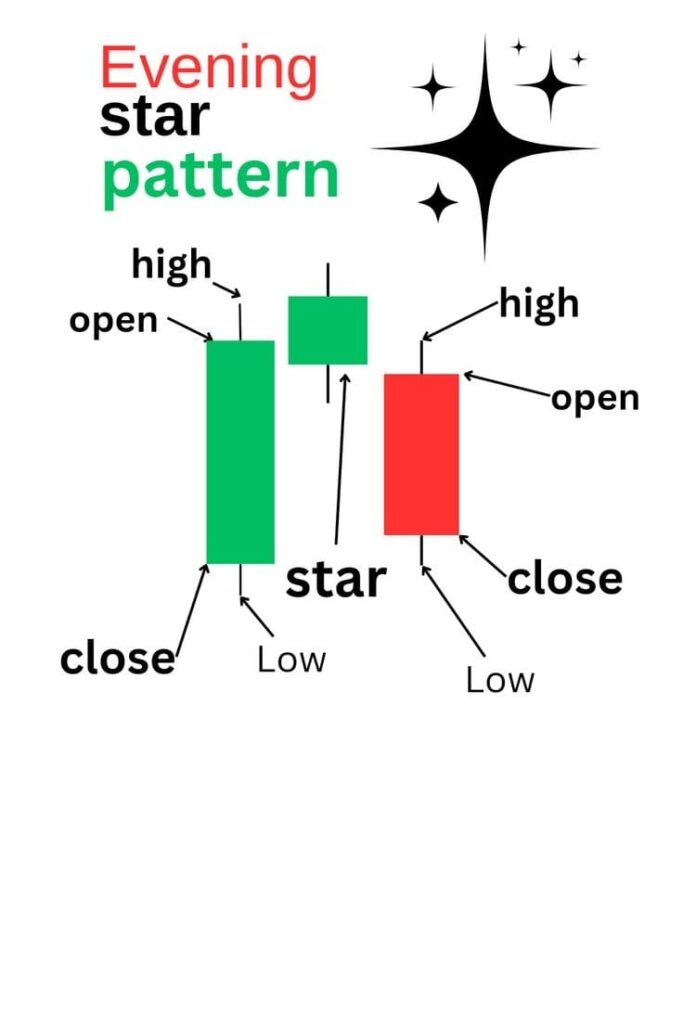
These are bearish candles. If only one green candle appears then it will appear in doji type, if any candle appears then a red candle will appear and if 70% of the niche is closed from the green candle then consider it as a perfect candle.
First, you will see an up trend on the chart, and then an evening star candle will be formed, it means that if the market changes its trend to the downside, then the evening star candle will be formed.
Morning star
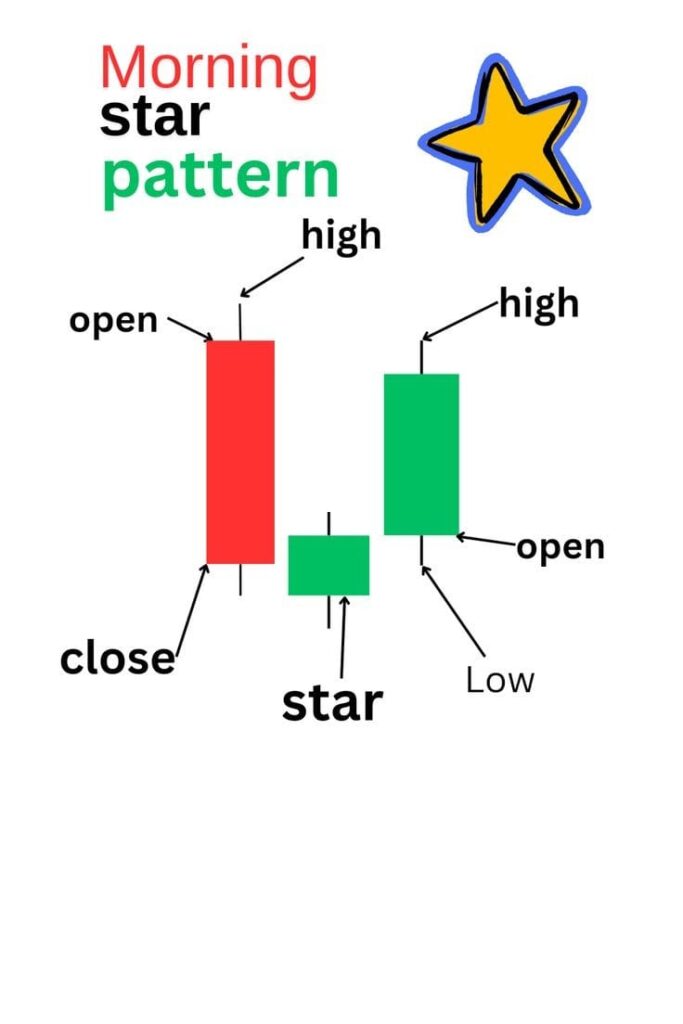
This is the opposite of the Evening Star candle. This is a bullish candle. If only one red candle appears then it will appear in the doji type, if there is a nest candle then it will appear in the doji type, if there is a green candle then it will have to close 70%-80% higher than the red candle, this is a perfect candle.
You will see the first downtrend on the chart and then a morning star candle will be formed, which means that the market will change its trend to the upside, hence the morning star candle will be lit.
PROS & CONS
> What will be the benefit?
All these candles I have mentioned have 70% to 80% accuracy for trading.
>USEFUL TIME
It can be analyzed on 5min, 15min, 1hour, 1day charts.
> What will be the loss?
Every trade will have a different entry, target and stop-loss.
I need additional confirmation before taking trades.
Conclusion:
From this, we can conclude that all these candles mentioned in our post are important. You can become a successful trader if you practice on candlestick charts for beginners. It keeps track of your exercises and how many exercises you’ve done on a chart.
FAQ
Ques: How to read a candlestick chart for beginners?
Reading a candlestick chart is essential for anyone looking to analyze price movements in markets, especially in stocks, forex, or cryptocurrency. Here’s a beginner’s guide on how to read a candlestick chart:
1. Understand the Components of a Candlestick
2. Candlestick Structure
3. Bullish vs. Bearish Candles
4. Timeframes
5. Reading Patterns
6. Volume
7. Trends
Ques: How to study Candlestick Pattern?
Studying candlestick patterns is a key aspect of technical analysis that helps traders predict future price movements based on historical price action. Here’s how to study candlestick patterns effectively:
1. Learn the Basics First
2. Familiarize Yourself with Common Candlestick Patterns
3. Study Candlestick Pattern Recognition
4. Understand the Context
5. Practice with Real Charts
6. Focus on the Most Important Patterns
Ques: How to predict the next candlestick?
Predicting the next candlestick involves analyzing a variety of factors, such as the current trend, candlestick patterns, volume, and other technical indicators. While it’s not possible to predict with 100% certainty, understanding the tools and techniques that can improve the accuracy of your predictions is essential.
Ques: Which candlestick time is best?
The “best” candlestick time frame depends on your trading style, strategy, and the market you’re trading in. Different time frames give you different perspectives on price action, and the best one for you will vary based on your objectives. Here’s a breakdown of popular time frames and when they’re most effective:
1. Short Time Frames (Scalping and Day Trading)
2. Medium Time Frames (Swing Trading)
3. Long Time Frames (Position Trading and Long-Term Investing)
Ques: How to calculate candlestick?
- Open: The price at which the asset opens during that period.
- Close: The price at which the asset closes at the end of that period.
- High: The highest price reached during that period.
- Low: The lowest price reached during that period.


